Notifications and Monitoring
Notifications
If the Radio operator has set up a Slack, Discord and/or Telegram bot integration and the Radio finds a POI mismatch, it sends alerts to the designated channels. The operator can also inspect the logs to see if the Radio is functioning properly, if it's sending and receiving messages, if it's comparing normalised POIs, if there is a found POI mismatch, etc.
Notification modes
Subgraph Radio supports three modes of notification, based on the user's preference for how often they'd like to get notified, and what data the notifications contain:
live- the Radio sends a notification as soon as it finds a divergence, providing the Subgraph deployment and the block.periodic-update- the Radio sends a notification on a specified interval (default is 24 hours) containing any updates to comparison results that have happened since the previous notification (the notification message format is the same as the one using live mode). If there are no updates it will not send a notification.periodic-report- the Radio sends a notification on a specified interval (default is 24 hours) with a summary of total subgraphs being cross-checked, number of matched subgraphs, number of diverged subgraphs, and a list of the divergent subgraphs and the blocks where the divergence was caught.
The default notification mode if there's Slack/Discord/Telegram integration in place is live.
The notification mode can be toggled using the NOTIFICATION_MODE and NOTIFICATION_INTERVAL configuration variables.
See more information on how to configure notifications, as well as how to set up Slack, Discord and Telegram in the advanced configuration section.
Prometheus & Grafana
The Subgraph Radio exposes metrics that can then be scraped by a Prometheus server and displayed in Grafana. In order to use them you have to have a local Prometheus server running and scraping metrics on the provided port. You can specify the metrics host and port by using the environment variables METRICS_PORT and METRICS_HOST.
Setting up the Grafana dashboard
The Subgraph Radio Grafana dashboard is included by default in Stakesquid's docker-compose stack. If you're not using the stack, below is a walk-through of how you can set it up.
There is a Grafana dashboard config JSON file provided in the repo, which you can import and use to visualise the metrics in Grafana. When importing the dashboard, it will require you to specify two data sources - a Prometheus one and a GraphQL one. For Prometheus you should select the Prometheus instance that you've set up to scrape metrics from Subgraph Radio's metrics host and port. For GraphQL, you'd need to install the Infinity data source plugin, if you don't have it already installed. The dashboard is configured to point to the default Kubernetes service deployments for Subgraph Radio using Launchpad Namespaces If you are deploying using a different configuration the dashboard endpoints will need to be adjusted on lines: 878, 890, 895 and 898. The format for these addresses is: http://<SUBGRAPH_RADIO_URL>:<SUBGRAPH_RADIO_GRAPHQL_PORT>/api/v1/graphql. You can learn more about the HTTP server in the next section.
Reading the Grafana dashboard
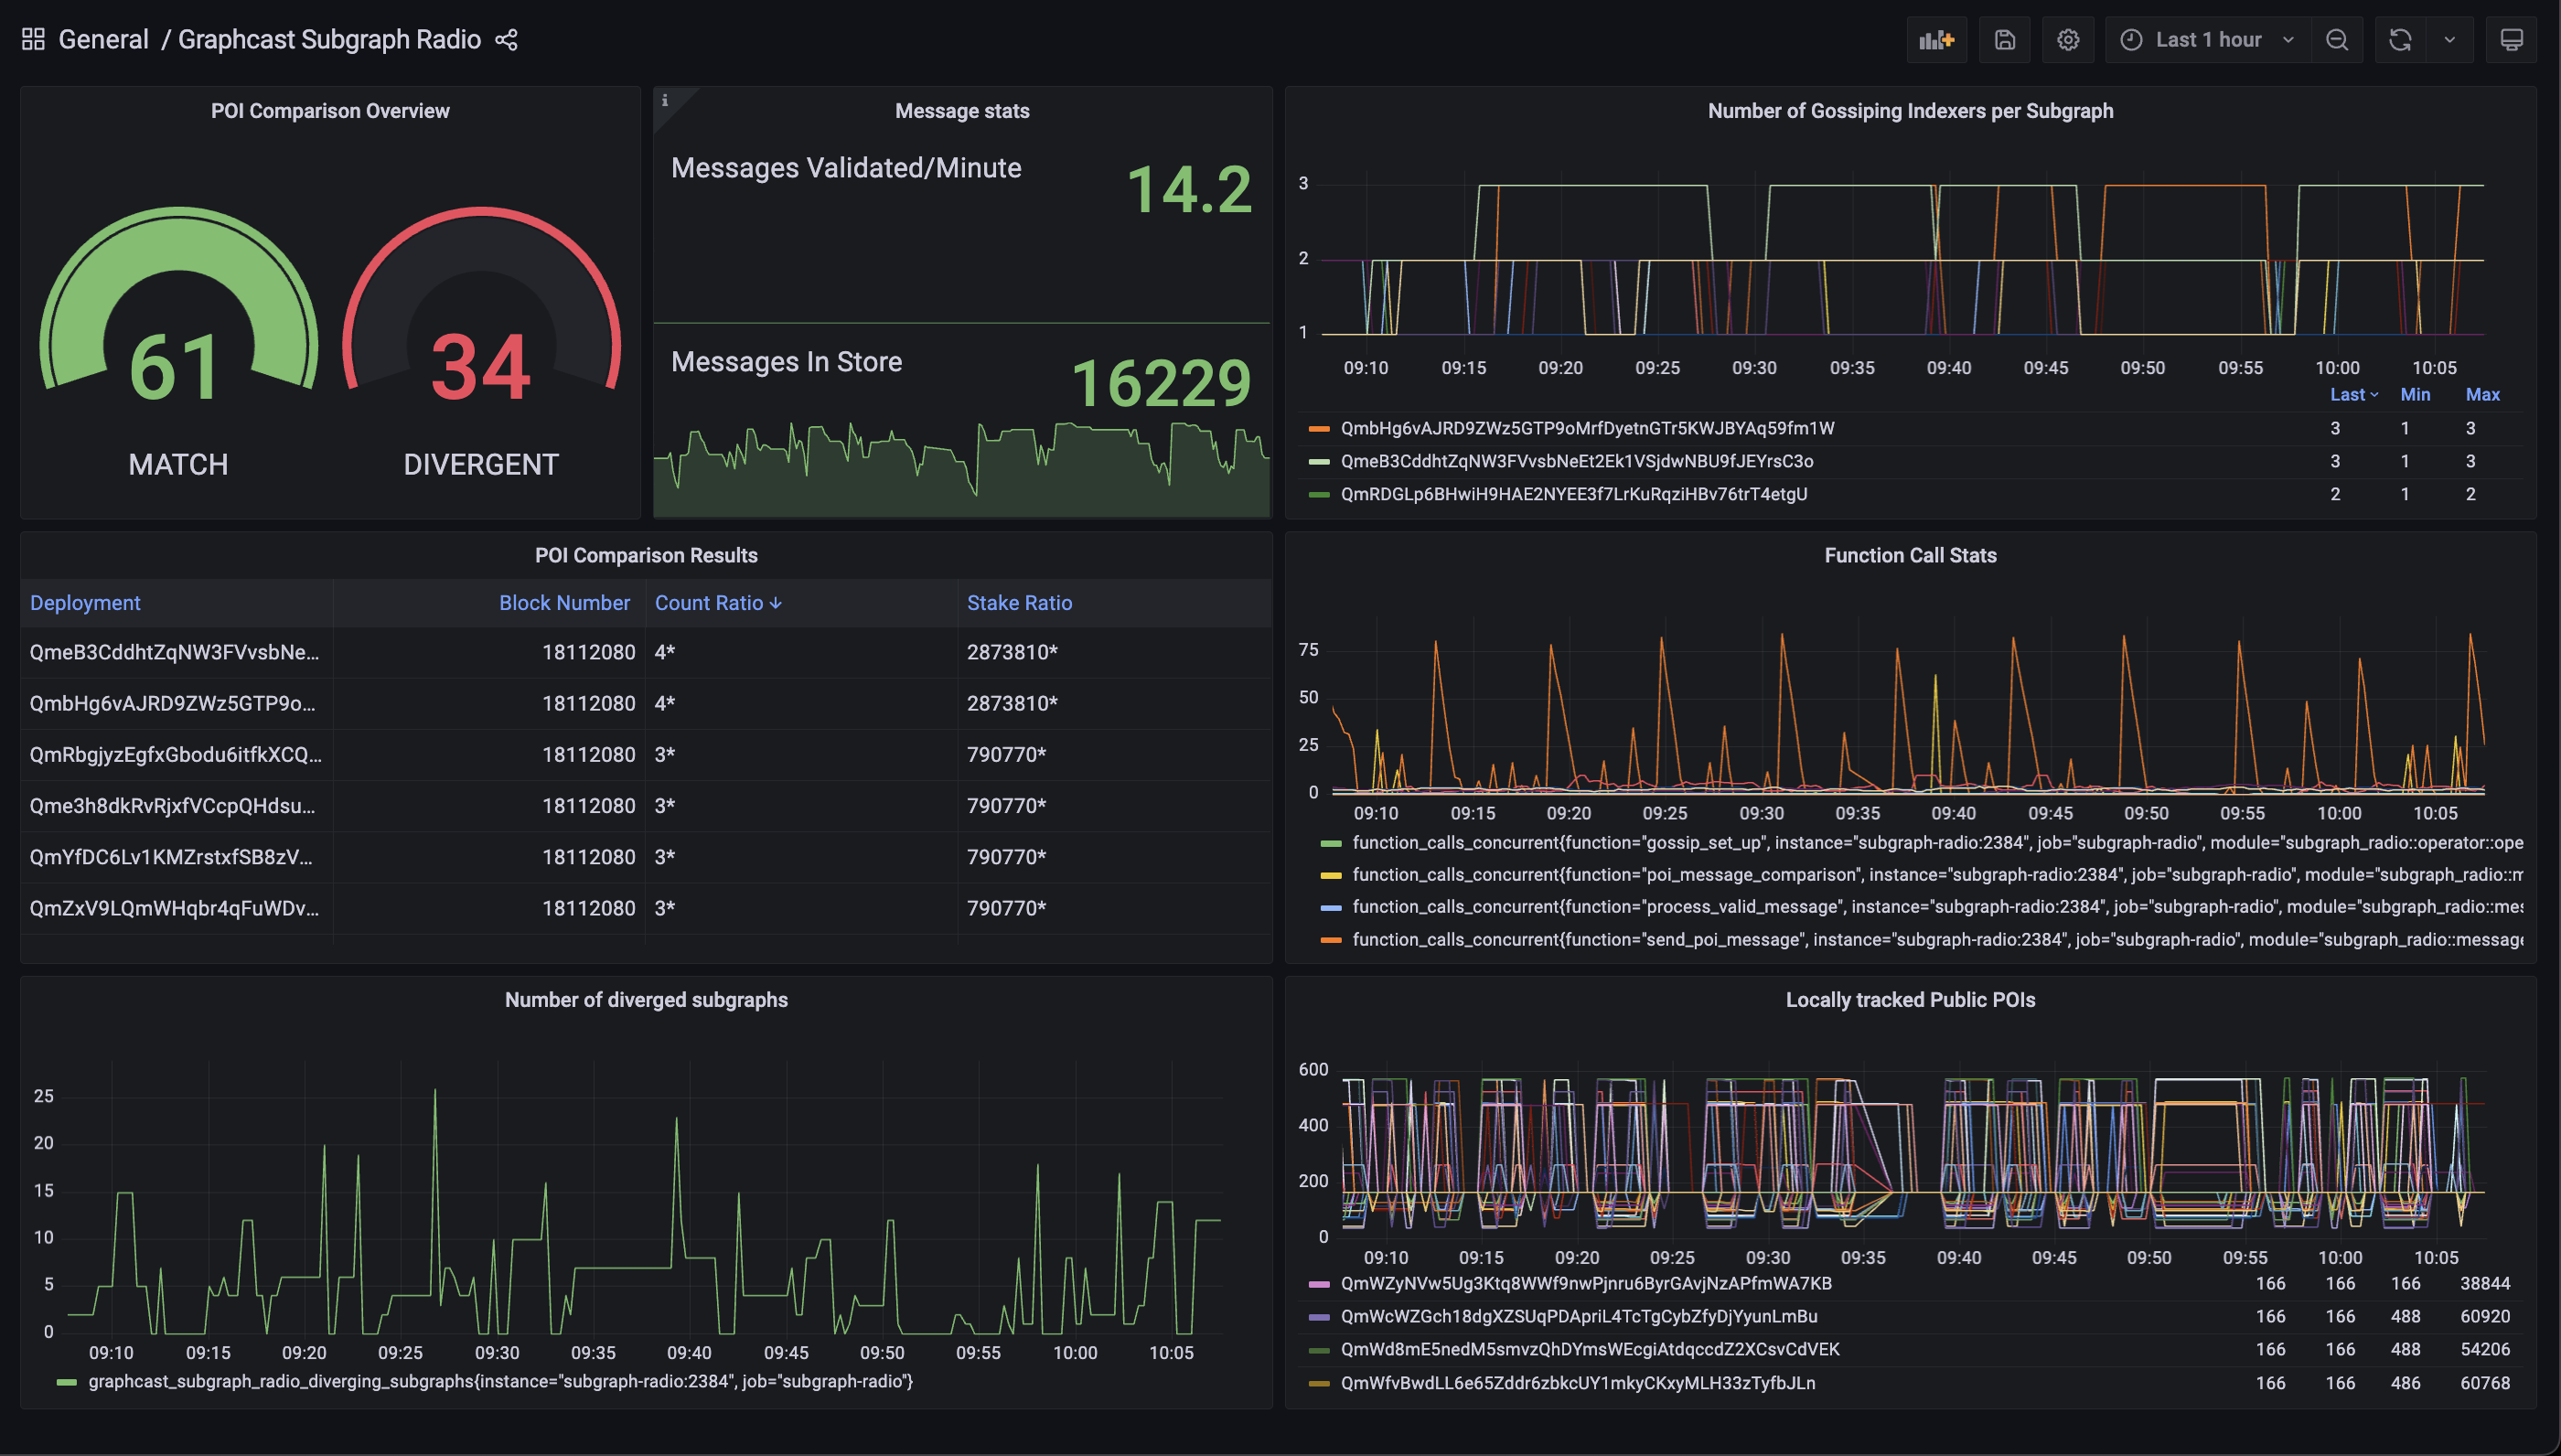
When the Subgraph Radio Grafana dashboard has been set up, it offers 6 panels:
POI Comparison Overview
At a glance, you can see the number of matching and diverging subgraphs. These two gauges update to reflect the results continiously after each comparison. The reason these are gauges and not counters is because a subgraph's comparison result can change between POI comparison events, for instance you might have a diverging public POI for a given subgraph on block X, but then at block Y it could be matching with the consensus public POI, in that case is would change groups, the number of divergent subgraphs would decrement and the number of matching subgraphs would increment.
Message stats
This includes the validated messages per minute, as well as the total cached messages in the store.
Number of Gossiping Indexers per Subgraph
This panel shows how many Indexers are actively sending public POIs for the subgraphs that you're interested in. This view can be filtered by a specific subgraph.
POI Comparison Results
This is the most insightful and important panel. The data in it is coming directly from the HTTP server's GraphQL endpoint. It shows the most recent comparison results for each subgraph that is being actively cross-checked, as well as the block for which that comparison happened.
The Count Ratio shows the ratio of unique senders that have attested to a public POI for that subgraph on that block. For instance 3:1:1* means that there are three distinct public POIs that were compared. It also means there are four Indexers attesting to public POIs that is different that the locally generated public POI, three of them attest to the same POI and the third Indexer attests to a different one, but none of those two POIs match the locally generated one. If it's 3*:1 it means that the local POI matches with the most often attested POI (highest sender count), meaning that the local Indexer is in that group of three Indexers, and there is one other Indexer who has sent a different POI. If it's 4* it means that there are four Indexers attesting to a given POI and all four POIs are the same (the local one included). The count that has a * sign is where the local attestation is.
Another possible ratio value is 3:0*, the 0* here represents that there is no local public POI, generated for this subgraph on this block (this might happen due to a lot of reasons, one of them being that the subgraph isn't fully synced).
The Stake Ratio is similar to the Count Ratio, but POIs are grouped by stake, so 11686531* means that that is the combined stake backing the public POI for that subgraph on that block (the local Indexer stake is included) where as for example 44141361*:651361 would mean that there are two distinct POIs and hence two different sender groups, and these two stake values are the aggregated stake values behind each of those POIs. The * on the first one means that the local Indexer's stake is attesting to the same public POIs and the local stake is included in that value. Similar to the Count Ratio, if there's a 0*, for instance - 44141361:0*, it means that there is no local public POI, generated for this subgraph on this block (therefore there is no attesting stake from the local Indexer).
Function Call Stats
Shows insights into the frequency of different functions running in the Radio, it helps convey a sense of how often/how many times certain events have happened, like POI comparison, processing a validated message, sending a message, and more.
Number of diverged subgraphs
Count of diverged subgraphs and how it's changed over time.
Locally tracked Public POIs
Number of locally generated public POIs for all of the subgraphs that are actively being cross-checked.